Many studies in evolutionary medicine will relay on trend examination with or without correlation analysis rather than experimentation. The experiment has long been accepted as a way to gather evidence for or against hypotheses. Yet often it is morally improper or impossible to design the protocols necessary to conduct the appropriate experiments to examine major evolutionary questions.
You need to consider that more observation has always been a legitimate way of testing scientific hypotheses. Example: Every time the sun sets in the west and rises in the east I am more convinced that it will continue to do so. (for your info if interested. Reason for the sun rising----http://www.universetoday.com/18117/why-does-the-sun-rise-in-the-east-and-set-in-the-west/)
For some obvious large scale evolutionary changes simple trend analysis, an extension of observation, is used.
Essentially a story is generated for a "trait" under selection and all the evidence pro and con is tabulated. It is very good if you can have alternative stories to contrast in term of evidence. Evidence that shows correlation between the proposed selective pressure and the trait's increase or decrease in frequency is valued.
_________________________________________________________________________
A correlative and trend analysis study that helped found epidemiology.
Dr. Snow, now recognized as the father of epidemiology, used observations and a mapped correlation to determine the cause of cholera. An observation based on interviews and city medical records. His hypothesis was that cholera was a water borne disease.
"The most terrible outbreak of cholera which ever occurred in this kingdom, is probably that which took place in Broad Street, Golden Square, and the adjoining streets, a few weeks ago. Within two hundred and fifty yards of the spot where Cambridge Street joins Broad Street, there were upwards of five hundred fatal attacks of cholera in ten days. The mortality in this limited area probably equals any that was ever caused in this country, even by the plague: and it was much more sudden, as the greater number of cases terminated in a few hours.
The mortality would undoubtedly have been much greater had it not been for the flight of the population. Persons in furnished lodgings left first, then other lodgers went away, leaving their furniture to be sent for when they could meet with a place to put it in."
Note that most cases of cholera map close to one water source.
Read the following passages.
"There are certain circumstances bearing on the subject of this outbreak of cholera which require to be mentioned. The Workhouse in Poland Street is more than three-fourths surrounded by houses in which deaths from cholera occurred, yet out of five hundred and thirty-five inmates only five died of cholera. . . . The workhouse has a pump-well on the premises, in addition to the supply from the Grand Junction Water Works, and the inmates never sent to Broad Street for water. If the mortality in the workhouse had been equal to that in the streets immediately surrounding it on three sides, upwards of one hundred persons would have died. "
" There is a Brewery in Broad Street, near to the pump, and on perceiving that no brewer's men were registered as having died of cholera, I called on Mr. Huggins, the proprietor. He informed me that there were above seventy workmen employed in the brewery, and that none of them had suffered from cholera--at least in a severe form--only two having been indisposed, and that not seriously, at the time the disease prevailed. "
" The men are allowed a certain quantity of malt liquor, and Mr. Huggins believes they do not drink water at all; and he is quite certain that the work-men never obtained water from the pump in the street. There is a deep well in the brewery, in addition to the New River water. "
Note that Snow felt it important to investigate individuals in the area of the outbreak that did not get cholera.
Why?
Sometime outlier points, or records in this case, strengthen not necessarily weaken the correlation implied.
________________________________________________________________________
Since correlation is used so much in evolutionary studies you need to understand the basics of this approach.
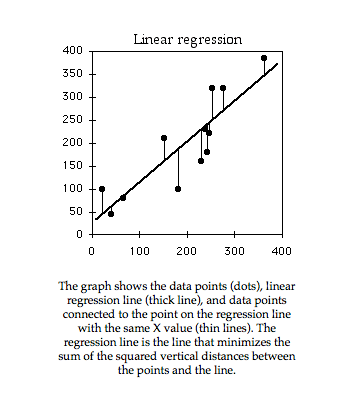
Correlations are trends, collections of observations, measured by the tightness of fit between two variables. Statistics is often used to determine how closely data points fit to a straight line drawn between them (linear regression).
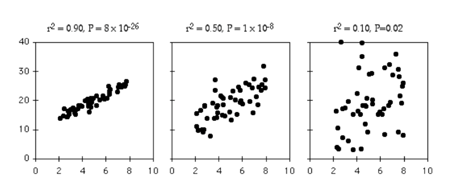
Three relationships with the same slope, but different amounts of "scatter" around an imagined best fit line. The closer the points to the line, the more likely we are to accept that the two variables are correlated, so that a change in x is accompanied by a predictable change in y.
Correlations suffice to help document many cases of natural selection in action, but it is always better if correlations can be tied to predictions as in our example above.
Lately non-experimental science has been dubbed discovery science. This seems a humble name for methods that have given us major theories in biology such as "the cell theory" and "evolutionary theory".
Monitoring gene frequencies
We have been lucky in some cases to be able to follow allele frequencies and document they are causing a directional change. The most likely explanation for a consistent directional change over generations is natural selection. We can model in general how we expect this directional change to occur.
Background information
What is a gene=allele=frequency?
Gene or allele frequency
Color is a co dominant trait (i.e. the heterozygotes differ phenotypically from both homozygotes), and the pink individuals are heterozygous. You sample a population of annual flower in 2022 and find the following phenotype frequencies:
Red Pink White
100 200 100
a. What are the gene frequency if one allele or factor is R1 (pigment), the other R2 (no pigment)
How do we start?
Allele frequency:
Freq. of R1= Number of red alleles in the population divided by the total number of alleles in the population = 2 (100) for R1R1 plus 200 for R1R2 divided by 2(400) alleles in the population.
b. You return to the population in 2023 and find the following phenotype frequencies:
Red Pink White
100 180 81
What changes have occurred in the population with respect to gene frequencies?
a. Calculate new gene frequencies.
For A1 = 100 X 2 for A1A1 plus 180 for AA2 = 380 A1 alleles divided by total number of alleles in the population or 2(361) = 380/772 = 0.53
For A2 =180 for A1A2 plus 2 x 81 for A2A2 individuals = 342 A2 alleles divided by total number of alles in the population of 2(362) = 342/772 = 0.47
So A1 alleles have increased and A2 alleles have decreased.
What factors could explain any differences noted?
Fitness
Also most simulations assume a fitness of 1 for the most successful genotype. Assume two breeding pairs of birds. One pair has 3 young. The other pair has 2 young.
That are their relative fitnesses if the maximum fitness is set at 1?
Several factors can affect relative fitness.
AA
Aa
aa
Survival rate
10%
10%
20%
Reproductive rate
10
8
6
Survival X Reprod.
0.1 X 10 =1.0*
0.1 X 8 = 0.8*
0.20 X 6 = 1.2*
Relative fitness (w)
1.0/1.2 = 0.83
0.8/1.2 = 0.67
1.2/1.2 = 1.0
The model
Assume: p=frequency of A
q=frequency of a
Fitnesses expressed in relation to a maximum of 1.
Only the frequency of one of the alleles is shown as in a two allele system if the frequency of one allele is increasing to 100 percent or 1, the other must be decreasing. The allele suspected of being selectively favored is usually the allele whose frequency is monitored on the y axis.
This allele will fluctuate from zero to one. (Mathematicians love creating 0-1 boundaries for variables -----do not confuse gene frequency in this model with relative fitness)
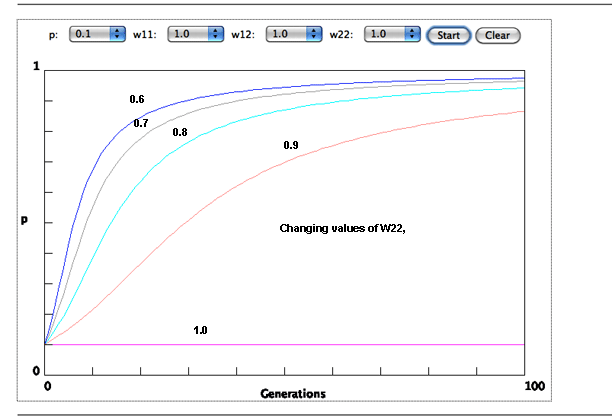
On the graph below fitnesses or w determine the frequency of p. The initial frequency of p is .1 but increases because w22 or the relative fitness of qq is in most simulation less than one. So the q allele decreases over generations. The different curves indicate different relative fitnesses (0.6 to 1) of w22 or qq. Note the pattern is always the same. So this summary graph indicates or models what pattern to expect for allele frequencies through time if natural selection is directing change.
The rate of p's increase slows down even if it is favored as the graph is one where the p allele is dominant. It becomes more difficult for selection to weed out the q allele as most of these alleles are hidden from selection in the heterozygote.
If selection instead favored the recessive phenotype, the frequency of q would more rapidly reach one.
So do we know it is natural selection?
a. Experiments are the best test. Often these cannot be done or for humans would be unethical. Much has been learned from "natural" experiments.
https://evolution.berkeley.edu/evo-news/warming-to-evolution/
b. Correlations suffice, but it is always better if correlations can be tied to predictions. https://evolution.berkeley.edu/evolibrary/news/090301_cichlidspeciation
_________________________________________________


